Advanced AM Modulation Analysis with Matplotlib
This post builds on AM Wave Generation and Plotting with Matplotlib. Once you can generate an AM waveform, the …
By Prabeesh Keezhathra
- 2 minutes read - 272 wordsAmplitude Modulation (AM) is a type of analog communication in which the amplitude of a carrier signal is varied in proportion to the message signal. It’s one of the oldest and most widely used forms of radio communication, still used in AM broadcasting and some aviation and military systems.
This post generates and plots an AM wave in Python, using NumPy for the math and Matplotlib for the plot. Familiarity with basic Python is useful; signal-processing knowledge isn’t required.
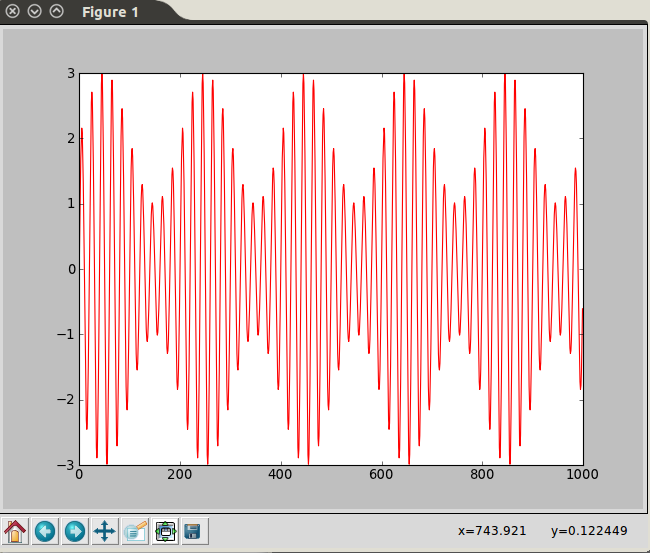
Import matplotlib.pylab and numpy, define the carrier frequency fc, the message frequency fm, and a time array t. Generate the carrier and message signals with NumPy’s sin, multiply them together to form the AM signal, and plot the result.
 1# Import the matplotlib.pylab and numpy modules
 2import matplotlib.pylab as plt
 3import numpy as np
 4
 5# Set the carrier frequency and message frequency
 6fc = 50
 7fm = 5
 8
 9# Generate the time array
10t = np.arange(0, 1, 0.001)
11
12# Generate the carrier signal
13c = np.sin(2 * np.pi * fc * t)
14
15# Generate the message signal
16m = np.sin(2 * np.pi * fm * t)
17
18# Generate the AM signal
19am = c * (2 + m)
20
21# Plot the AM signal
22plt.plot(am, 'r')
23plt.show()
This produces an AM wave with a 50 Hz carrier and a 5 Hz message, plotted via Matplotlib:
For more on Matplotlib, see the Matplotlib Artist tutorial. From here, try adjusting fc and fm to see how the carrier and message frequencies interact, or add noise to the signal and see how the plot changes.